François Blanchard
Cartographer & Geographer · Seville, Spain
I'm interested in how maps can do more than show data: they can shape how you read a territory, and tell a story.
Travaux sélectionnés — 7 projets
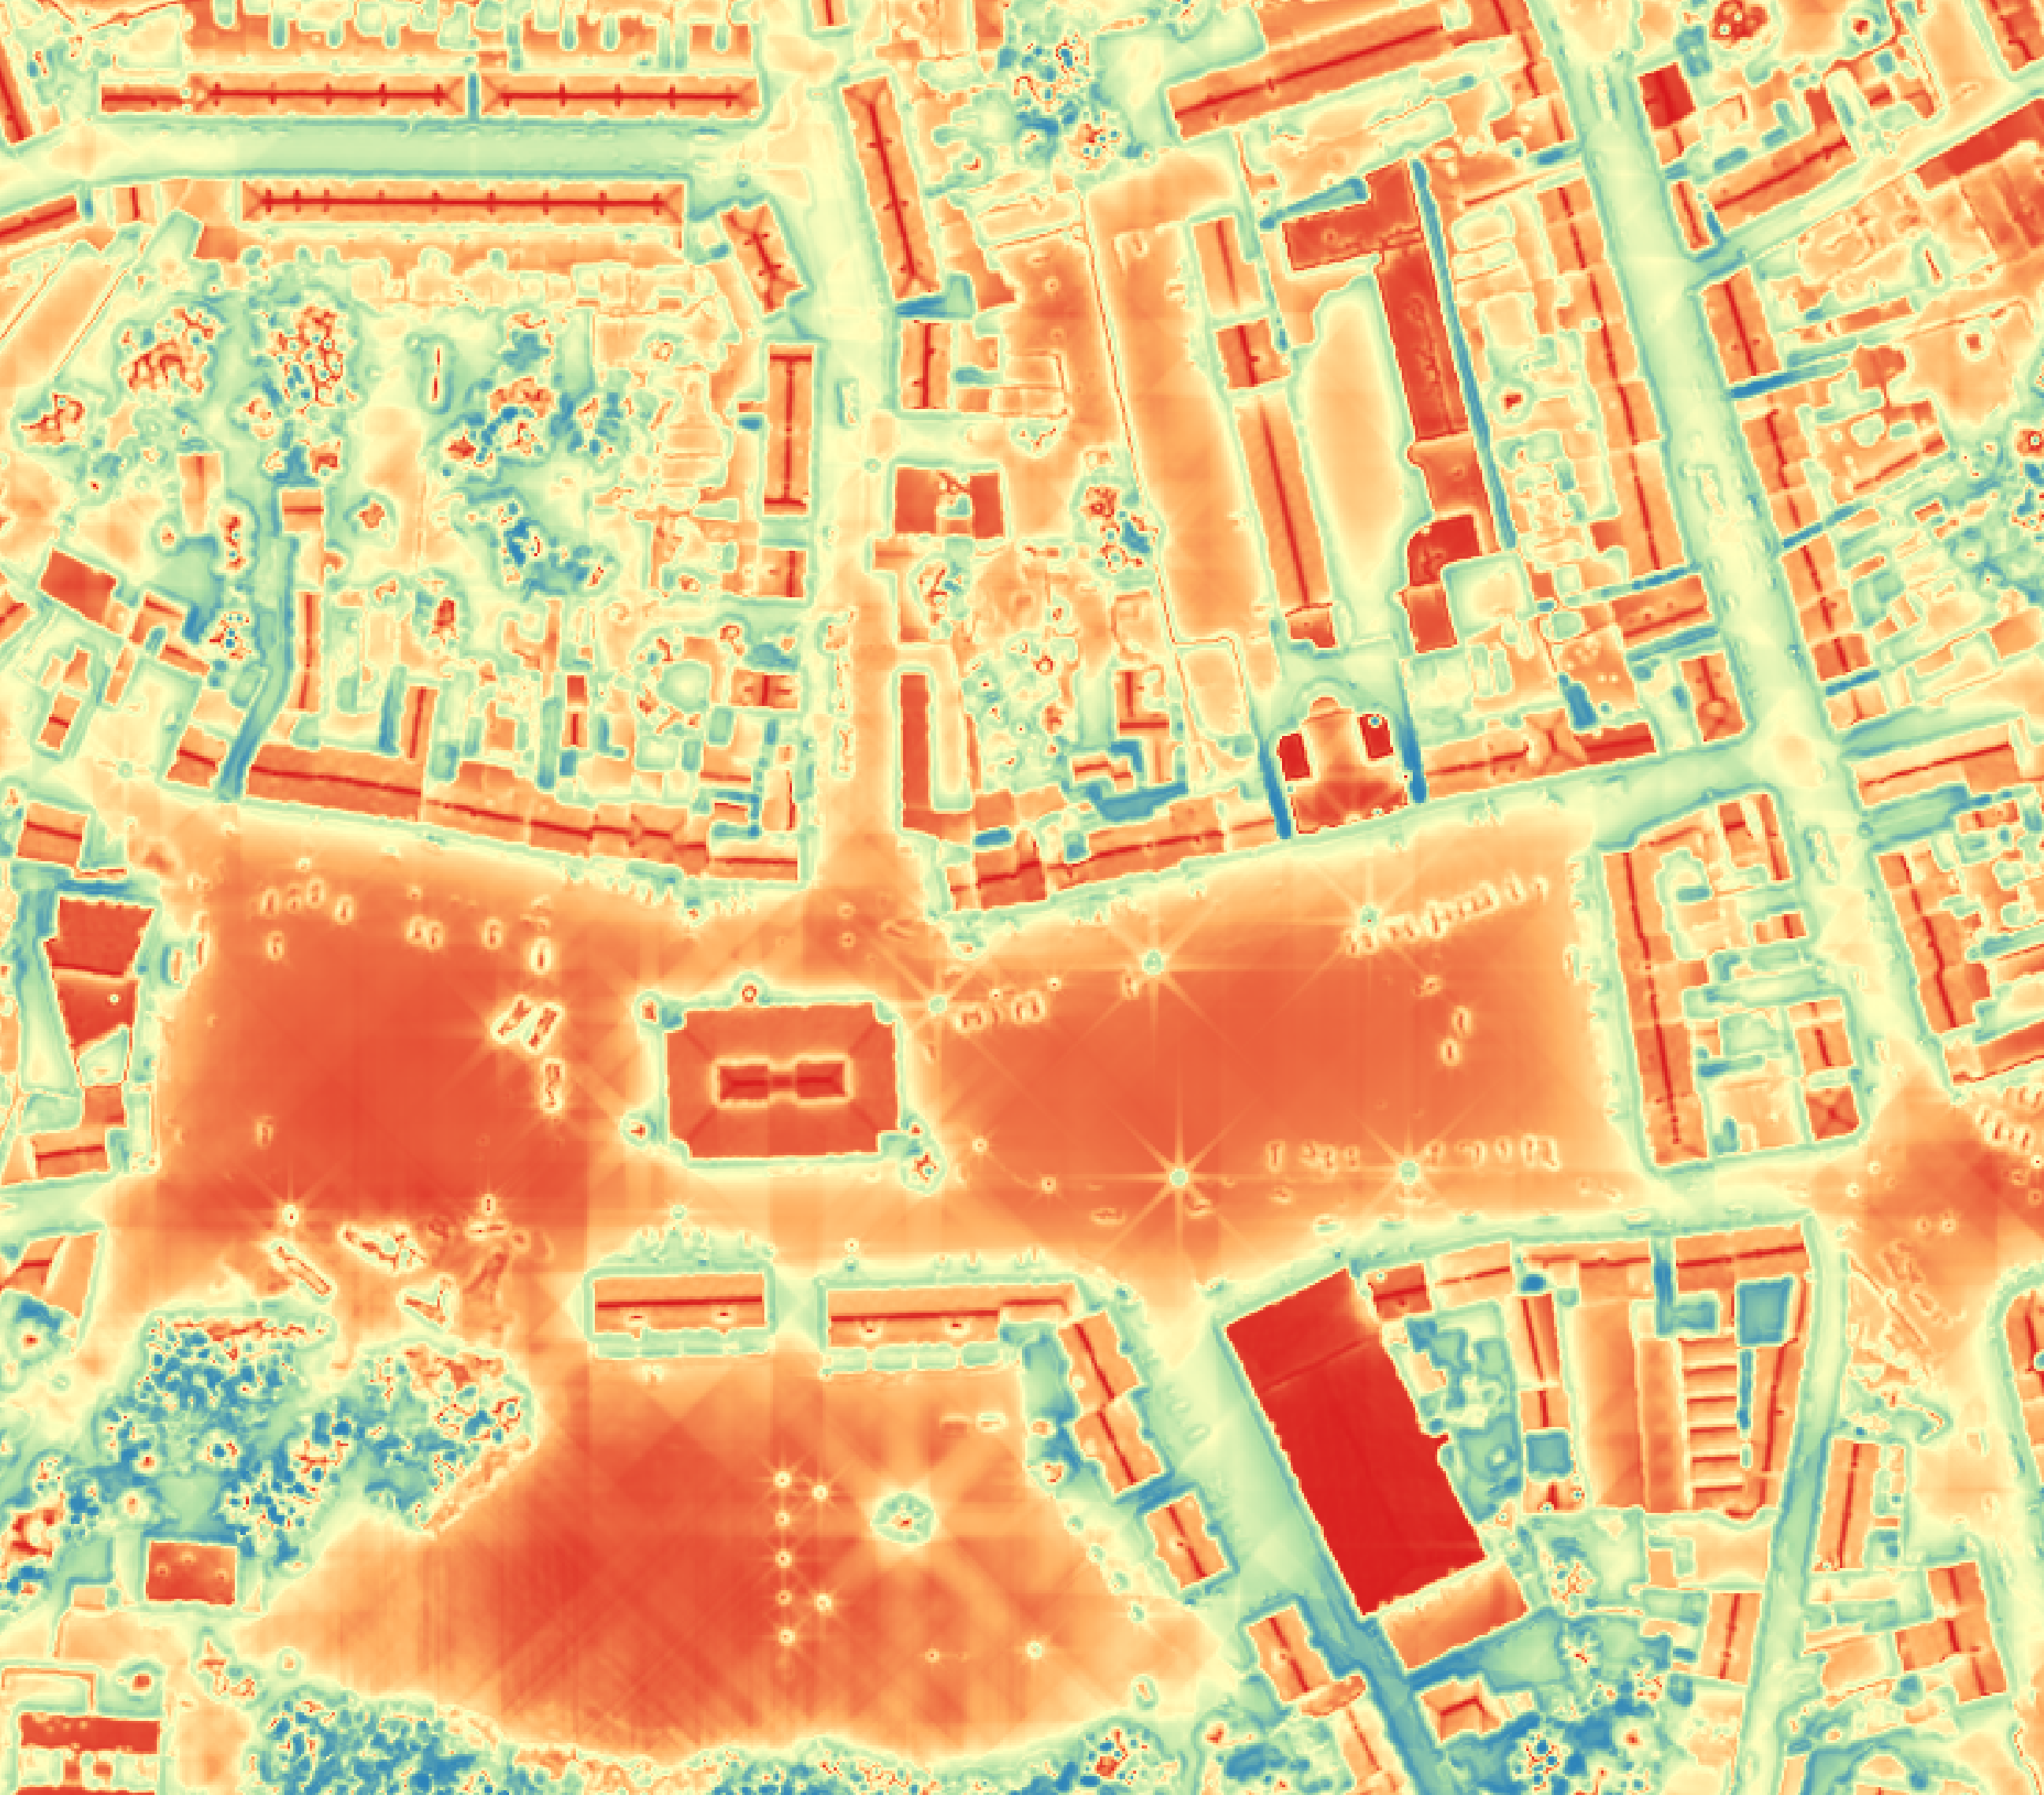
Fig. 01 · 2023–2024
Environnement
Îlots de chaleur urbains
Modélisation de l'irradiance solaire bâtiment par bâtiment sur le tissu urbain andalou. Croisement des données LiDAR, du cadastre 3D et de modèles radiatifs pour identifier les façades les plus exposées et orienter les stratégies d'adaptation au climat.
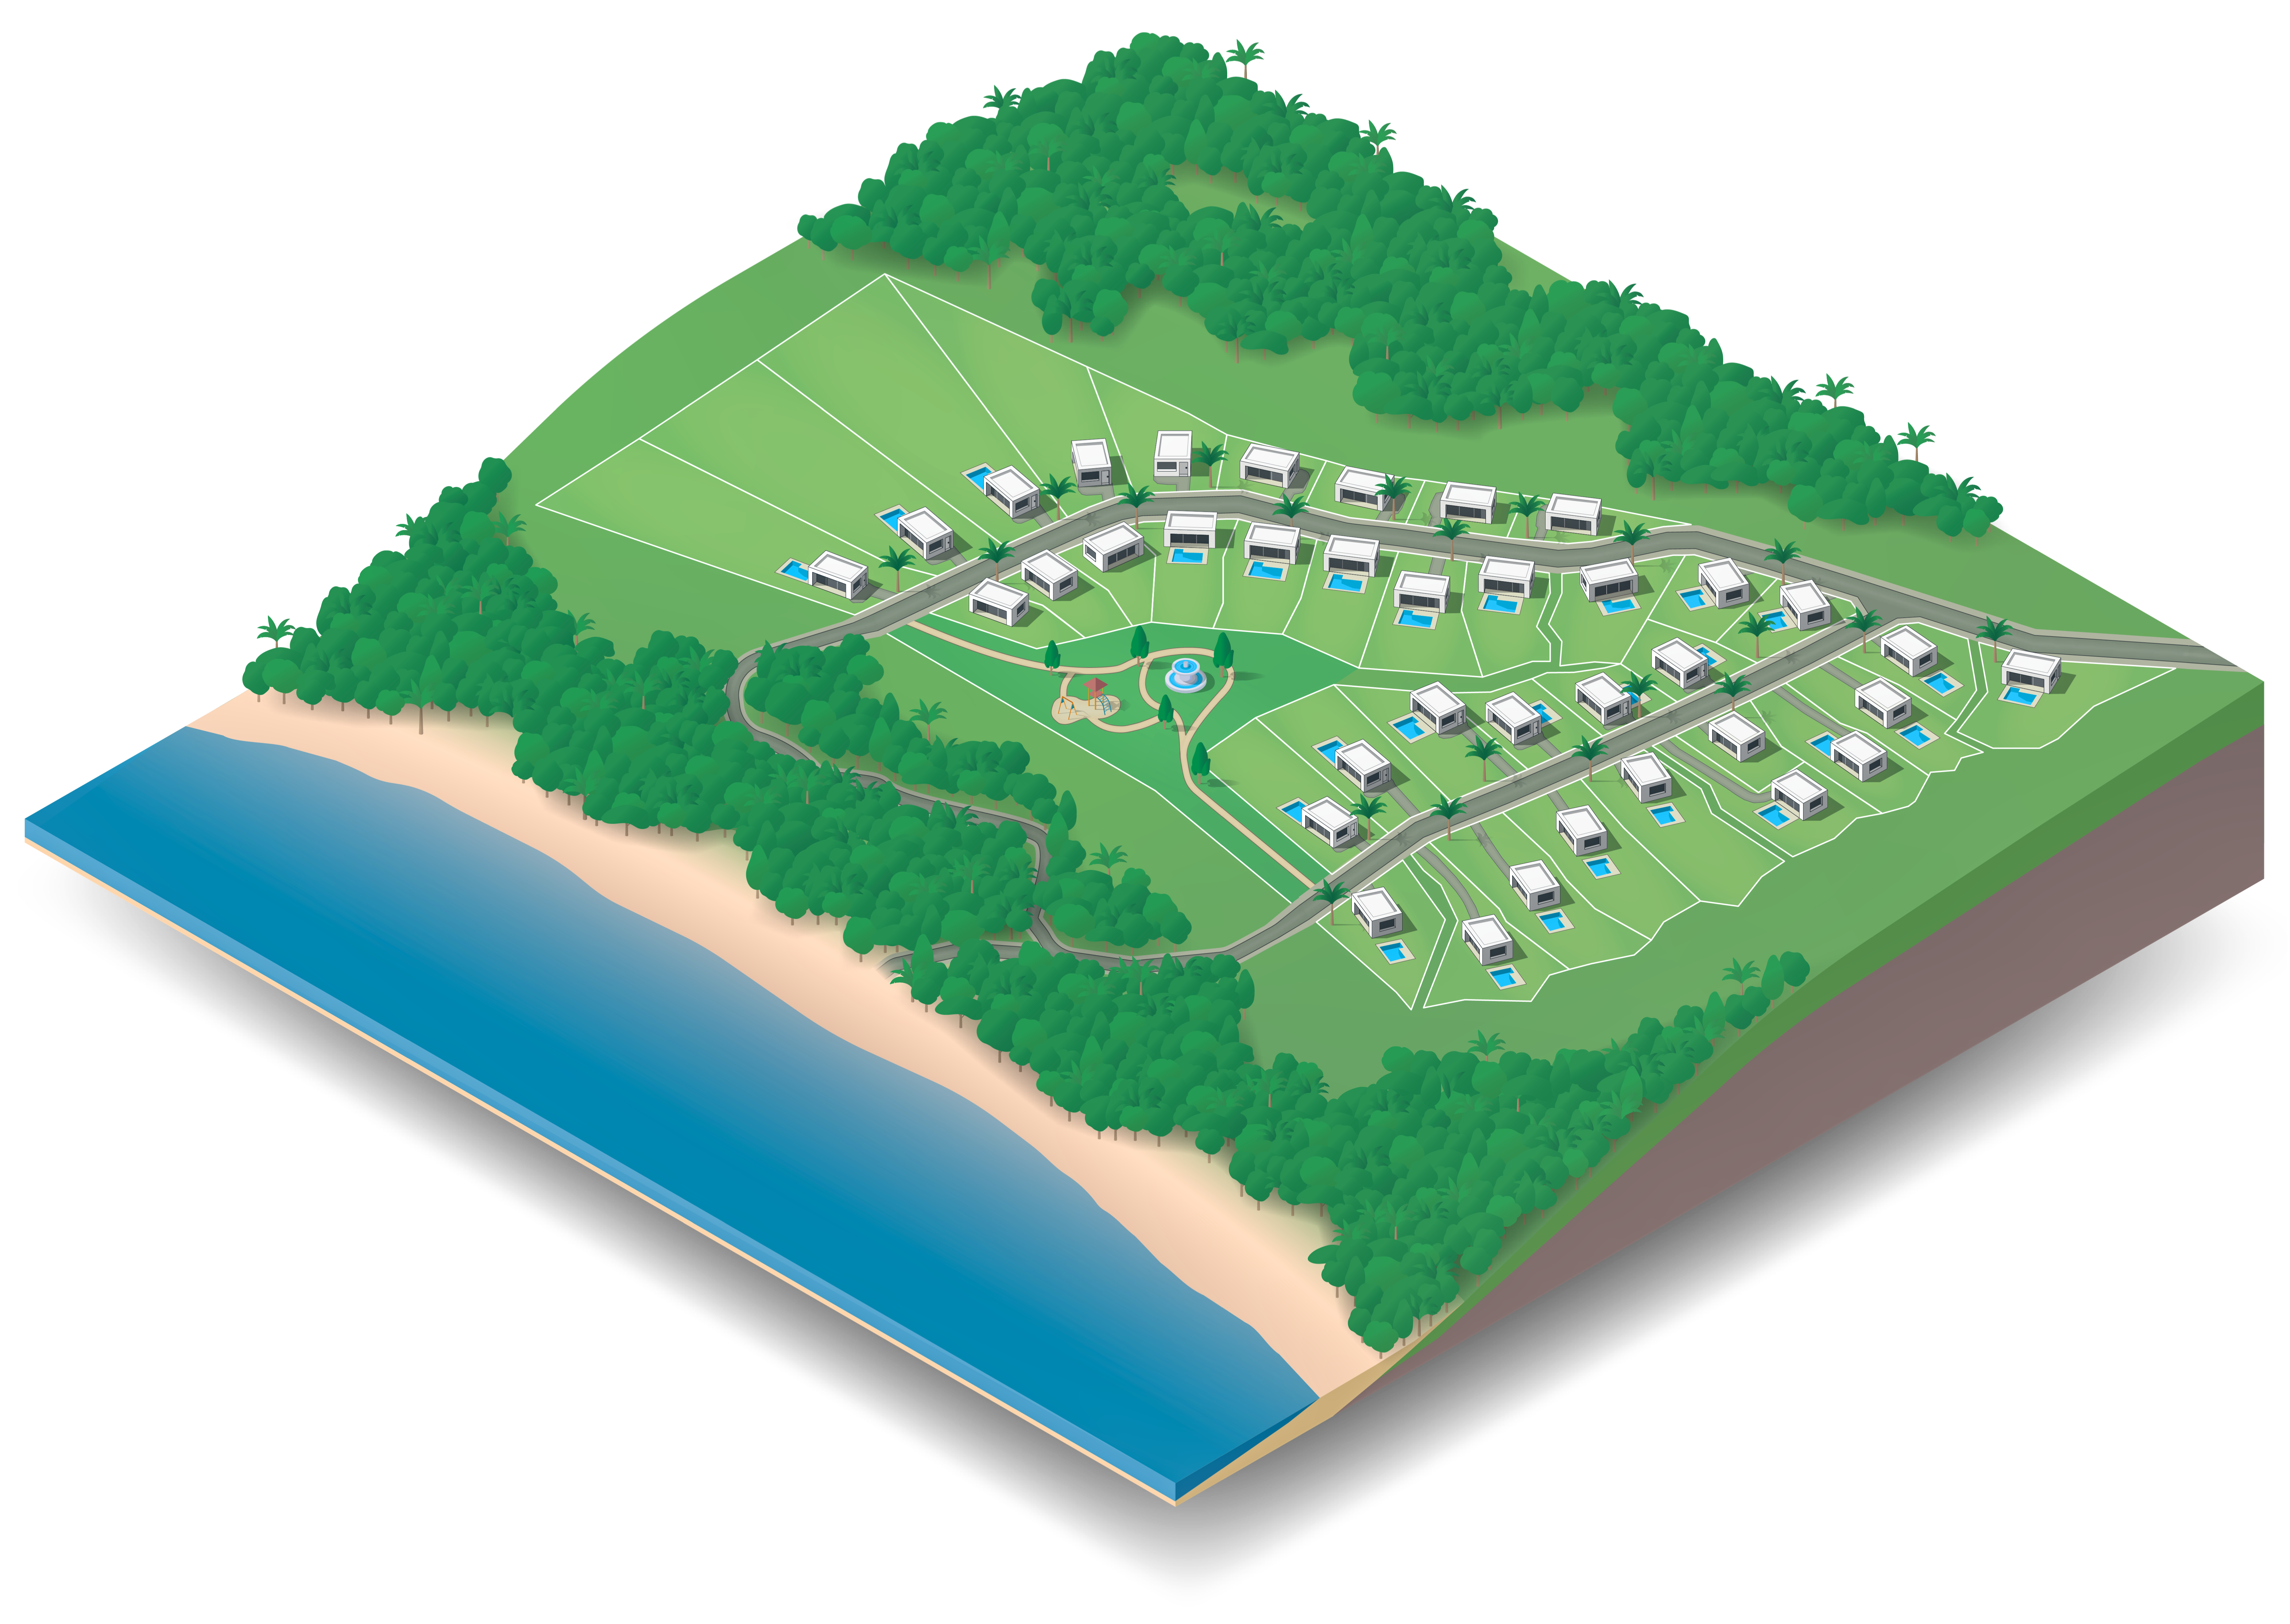
Fig. 02
Cartographie & SIG
Hermosa Bay
Cartographie axonométrique d'une marina mêlant données bathymétriques et inventaire des pontons. Un exercice de représentation où la troisième dimension devient outil narratif autant qu'outil d'analyse.
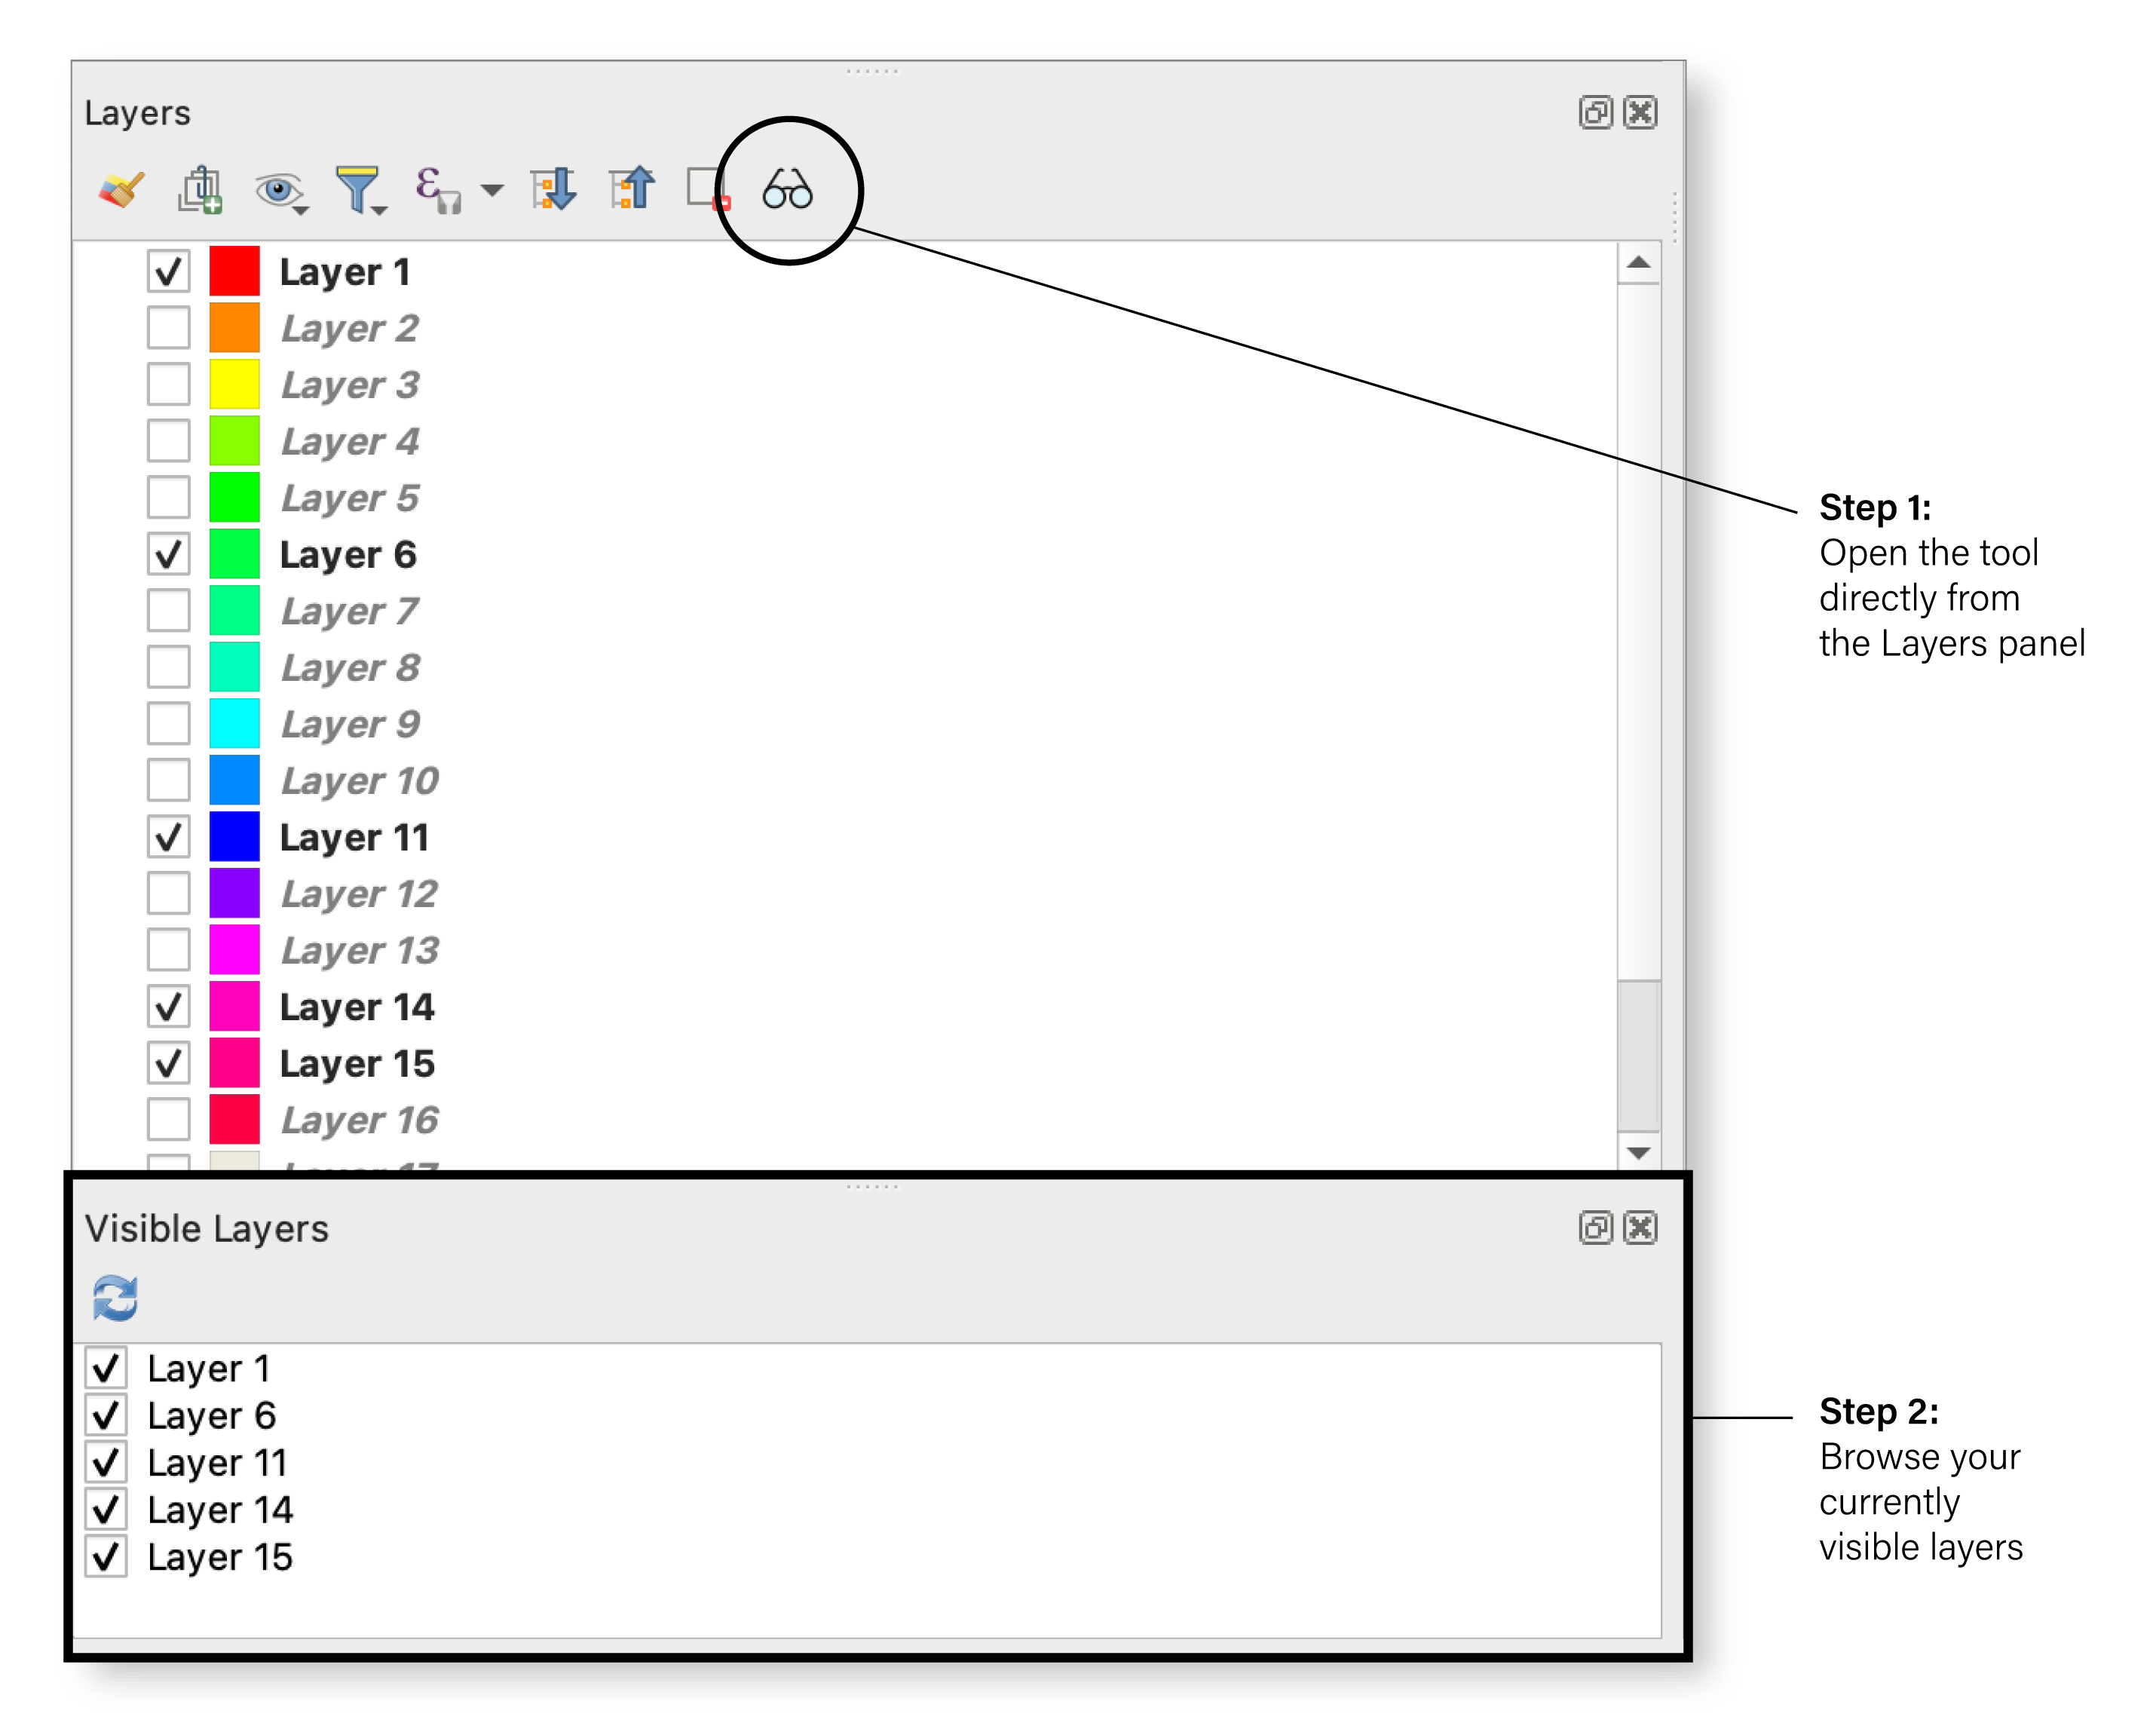
Fig. 03
Outils & Plugins
Visible Layers
Plugin QGIS open source qui restreint la table des matières aux seules couches effectivement visibles à l'écran. Né d'une frustration quotidienne, distribué sur le dépôt officiel.
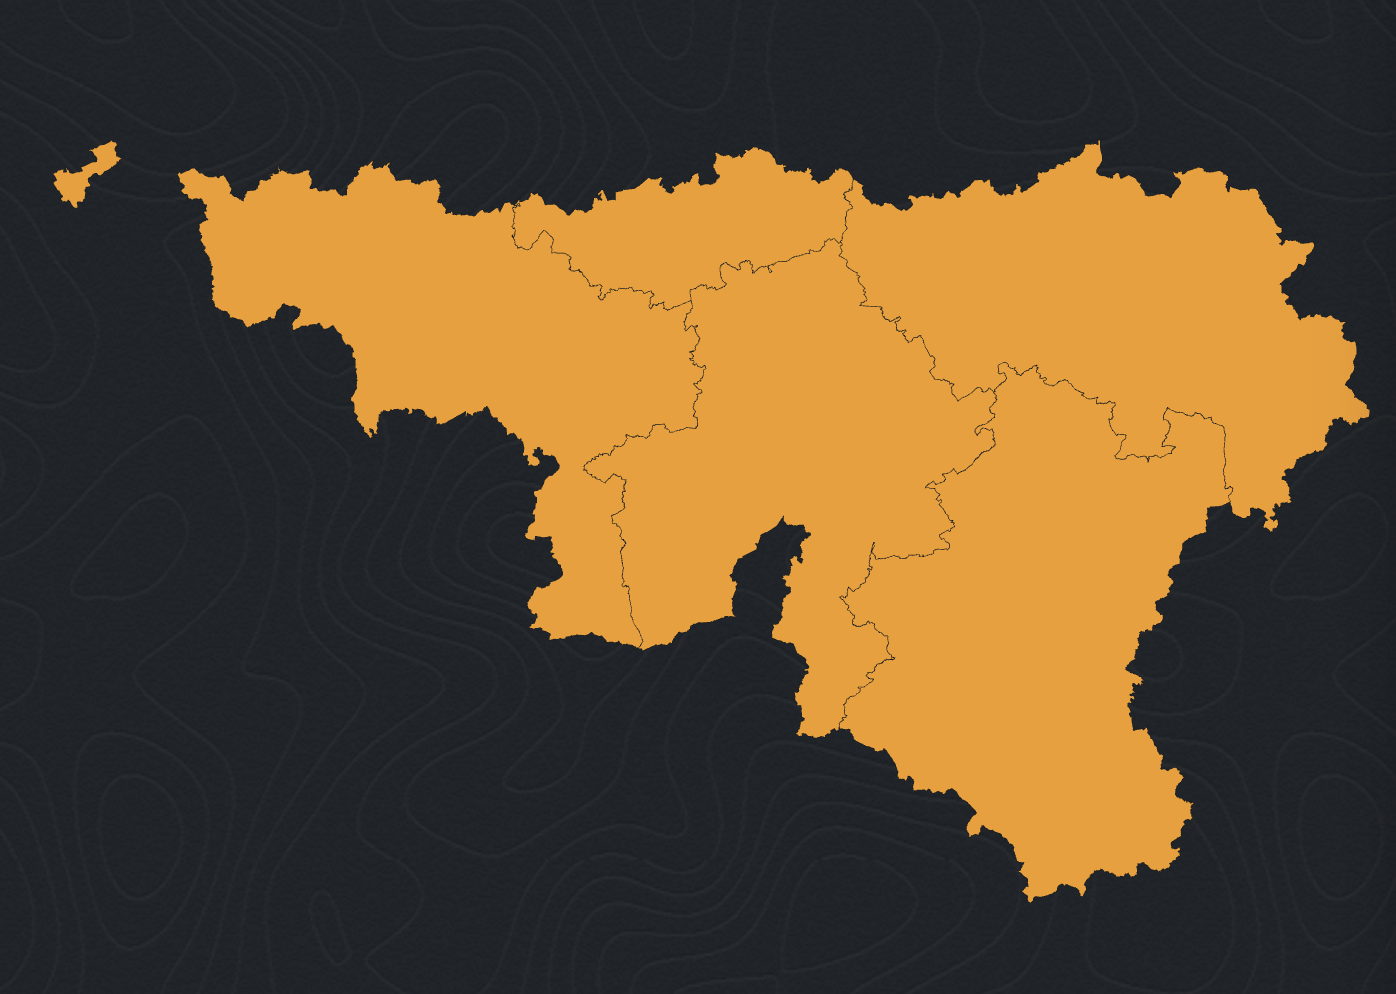
Fig. 04
Cartographie & SIG
Urban Audit
Outil d'aide à la décision qui génère, pour une parcelle donnée, un rapport synthétique : zonage, servitudes, risques, accessibilité. Concevoir l'analyse pour qu'elle reste lisible à qui n'est pas géomaticien.
Fig. 05
Environnement
Ville du quart d'heure
Calcul d'isochrones piétons à partir d'OpenStreetMap pour évaluer l'accessibilité aux aménités du quotidien — école, marché, parc, médecin. Une lecture du droit à la ville par la marche.
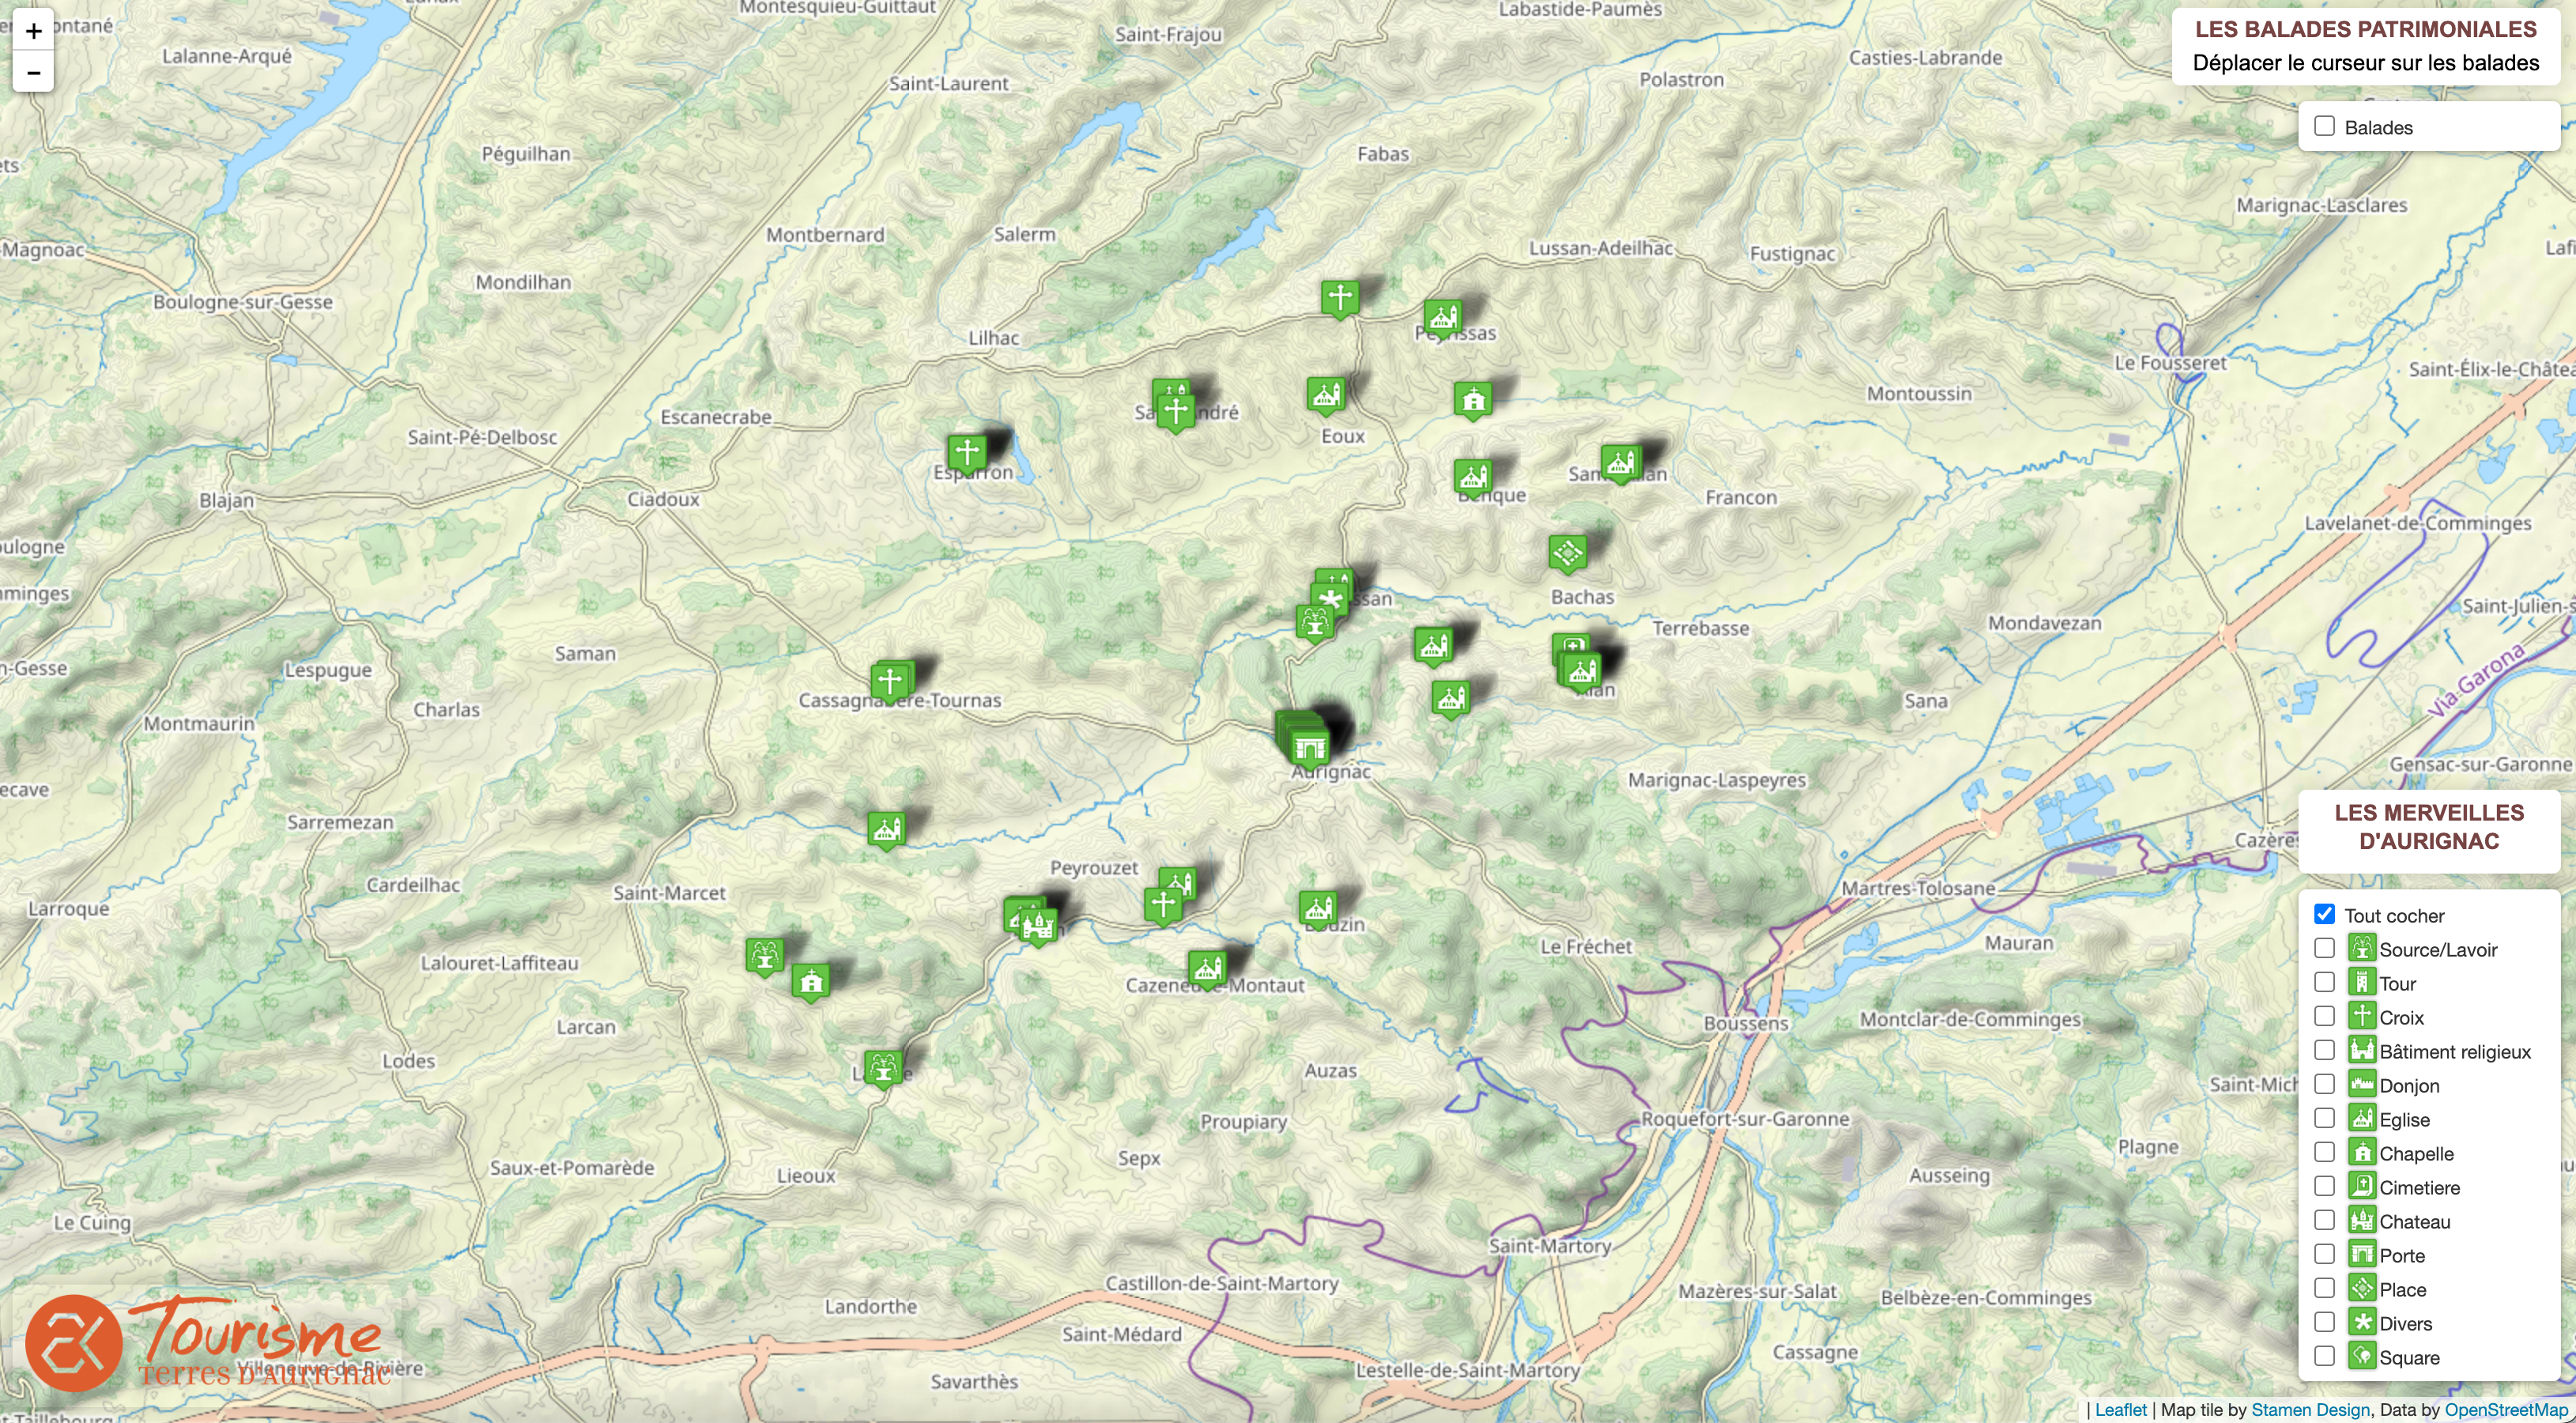
Fig. 06 · 2014
Archive
Première carte interactive
Une carte de la commune d'Otta réalisée à la main pendant mes études, alors que les bibliothèques web cartographiques en étaient à leurs débuts. Pièce conservée comme point de départ.
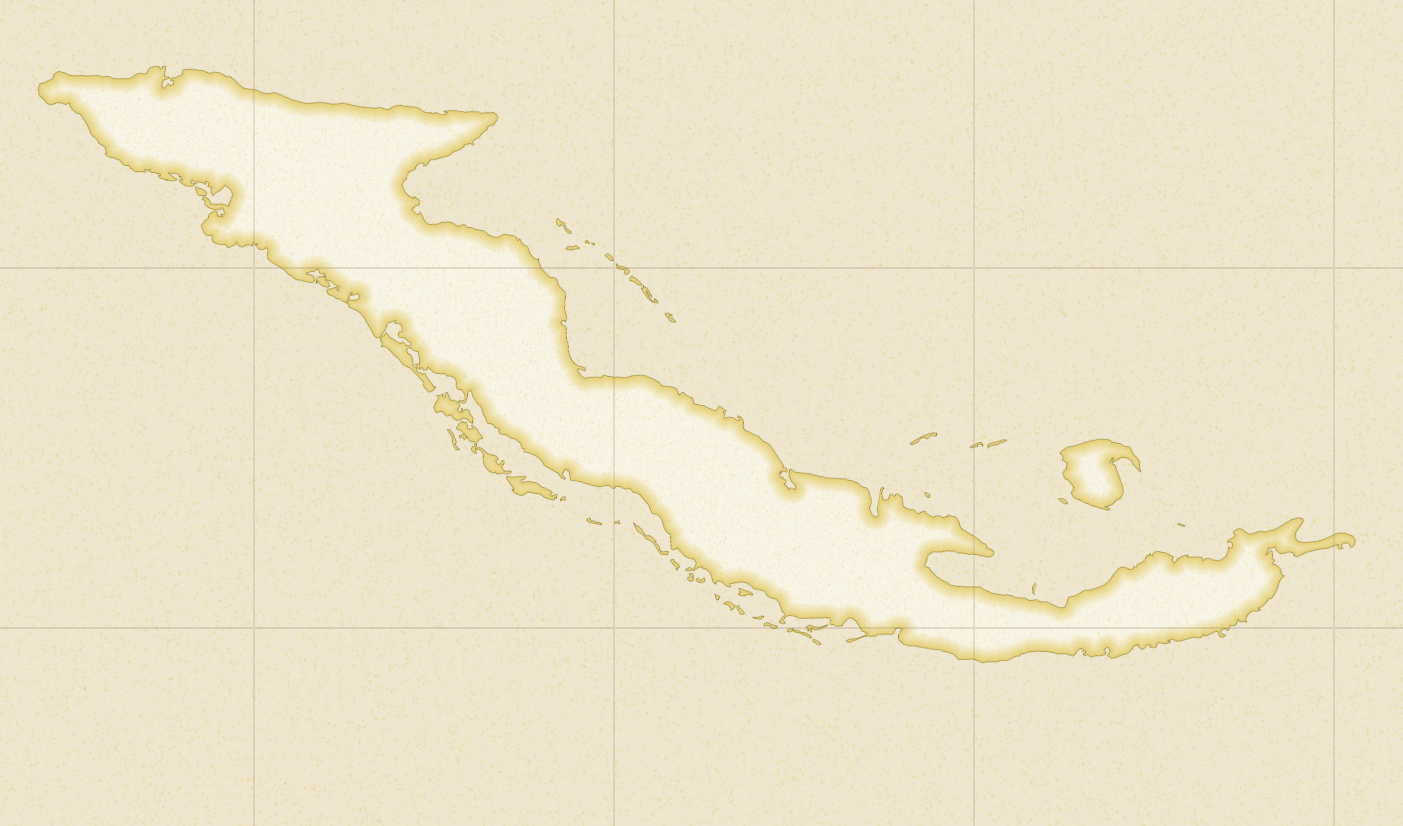
Fig. 07
Environnement
Îlots de fraîcheur
Recensement et cartographie web des refuges climatiques accessibles au public — fontaines, parcs ombragés, bâtiments rafraîchis. Outil destiné aux populations vulnérables pendant les vagues de chaleur.